Live statistics: broadcast history, viewers and peak
Statistics › Live lists each broadcast with date, duration, destinations, views and comments, and the chart of the last days. In Details you see the channels used, the peak by source, the viewers curve and the comments.
Every time you click Start and Stop Transmission, the panel keeps a broadcast in the history, with the audience added up from every destination that reports viewers. It is the page to answer "how many people watched" and "which live went best".
Where it is: Applications › your video application › Statistics › Live.
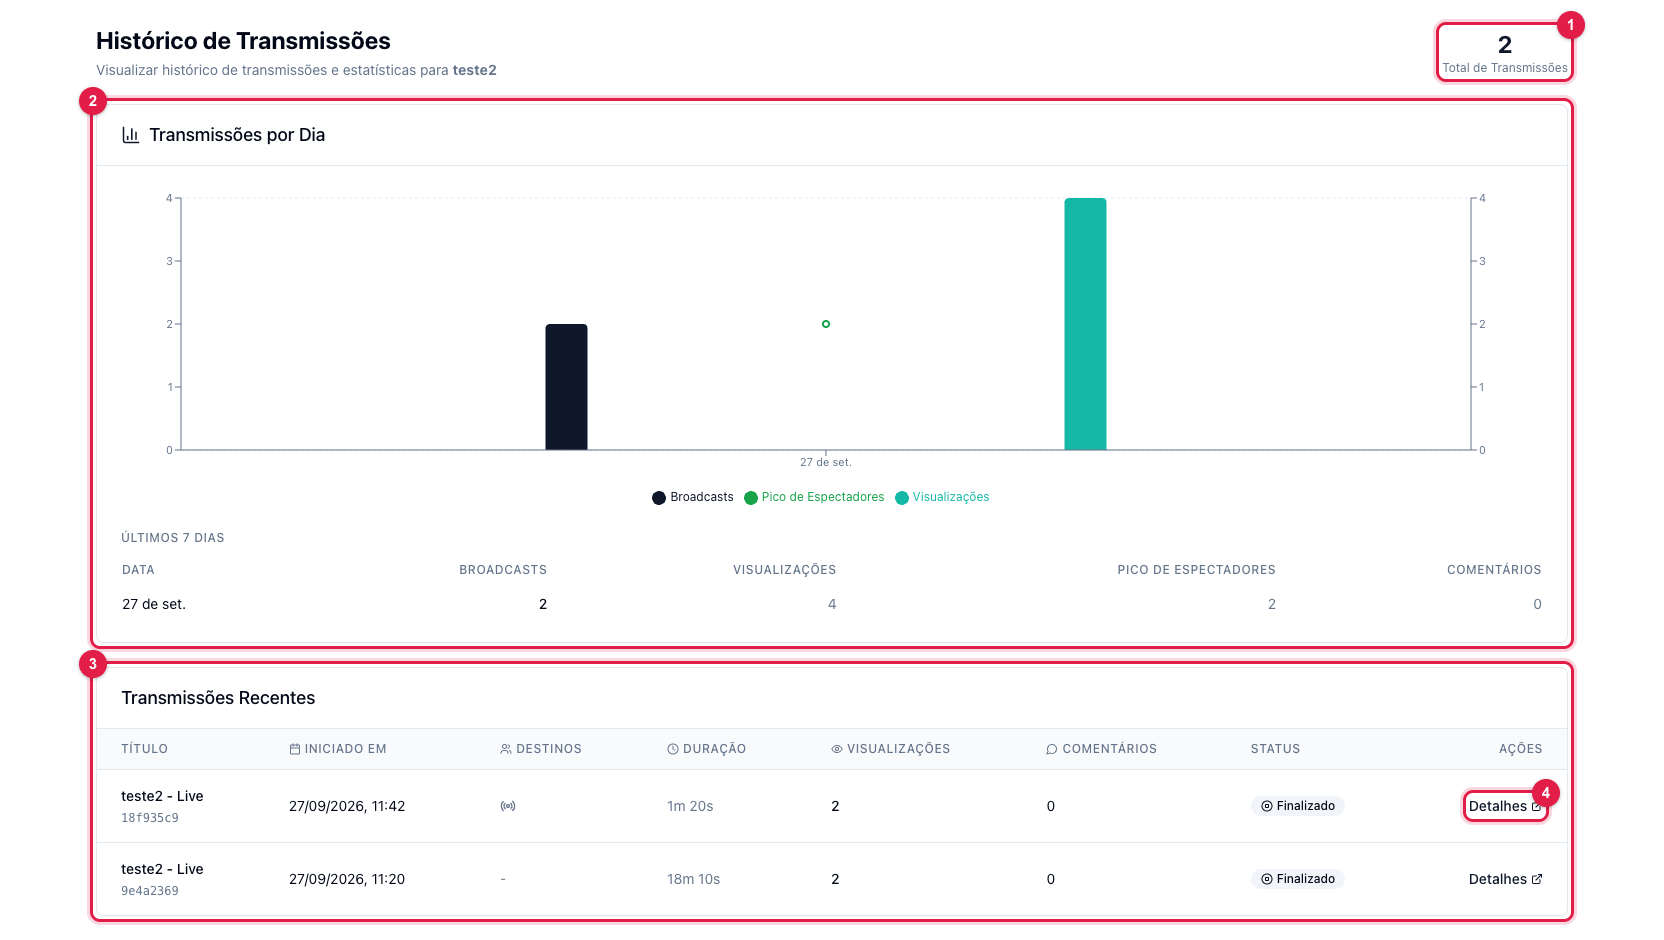
The numbers in parentheses refer to the image.
The page
- Total Broadcasts (1) — how many lives the application has done.
- Broadcasts by Day (2) — the chart of the last days: how many lives, the peak viewers and the views of each day; below, the same information in a table, with the comments.
- Recent Broadcasts (3) — one row per live: title, when it started, destinations used, duration, views, comments and the status (Active while on air, Finished afterwards).
Details of a broadcast
Click Details (4) on the row:
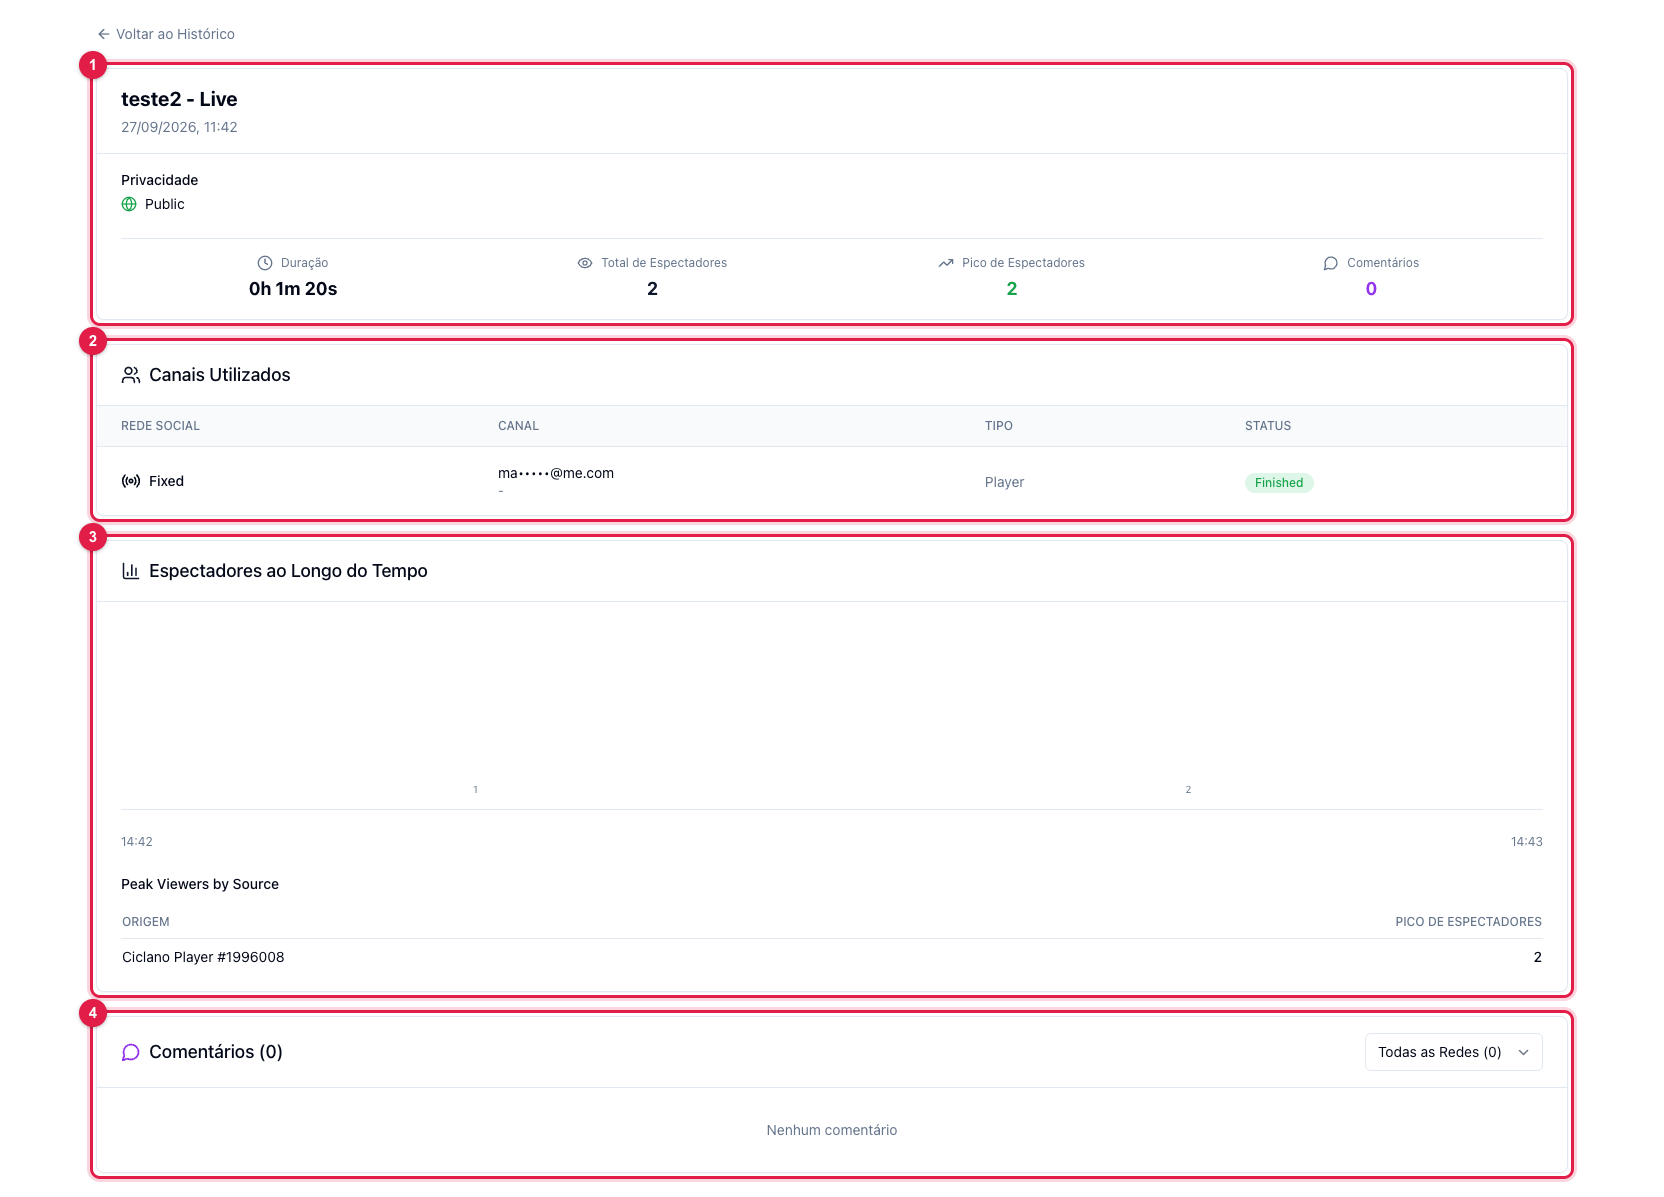
- General data (1) — the title and date, the privacy sent to YouTube, the duration and the totals.
- Channels Used (2) — each destination that received the live, with its type and final status.
- Viewers Over Time (3) — the audience curve during the live and, below, the peak by source: how many on the Ciclano Player, how many on each network. It shows whether the audience is on your website or on YouTube.
- Comments (4) — everything that was commented, with a network filter.
How the audience is counted
- The Ciclano player counts each connection to the video; the networks report the number of simultaneous viewers they themselves display.
- Views is the accumulated total; Peak is the highest number of people at the same time. A two-hour live with 50 people the whole time has peak 50 and higher views, because people come and go.
- Custom RTMP destinations (Instagram, TikTok) do not report audience over RTMP: they show in Channels Used, but do not add viewers.
- Old lives, from before the audience-over-time collection, show only the totals, without the curve.