Radio listener history: sessions, countries, devices and best times
The Statistics History screen shows the audience by period: sessions, unique listeners, minutes, data transferred, peak, and the best time and day insights. See how to choose the period and read each tab.
The Statistics History answers "how was the audience" for any period: today, yesterday, the last 7, 30 or 90 days, this month, last month or dates you choose. Besides the totals, it tells at what time and on which weekday your radio has the most people — information worth gold for placing a live show or selling a commercial.
Where it is: Applications › your radio › Statistics › Listener History.
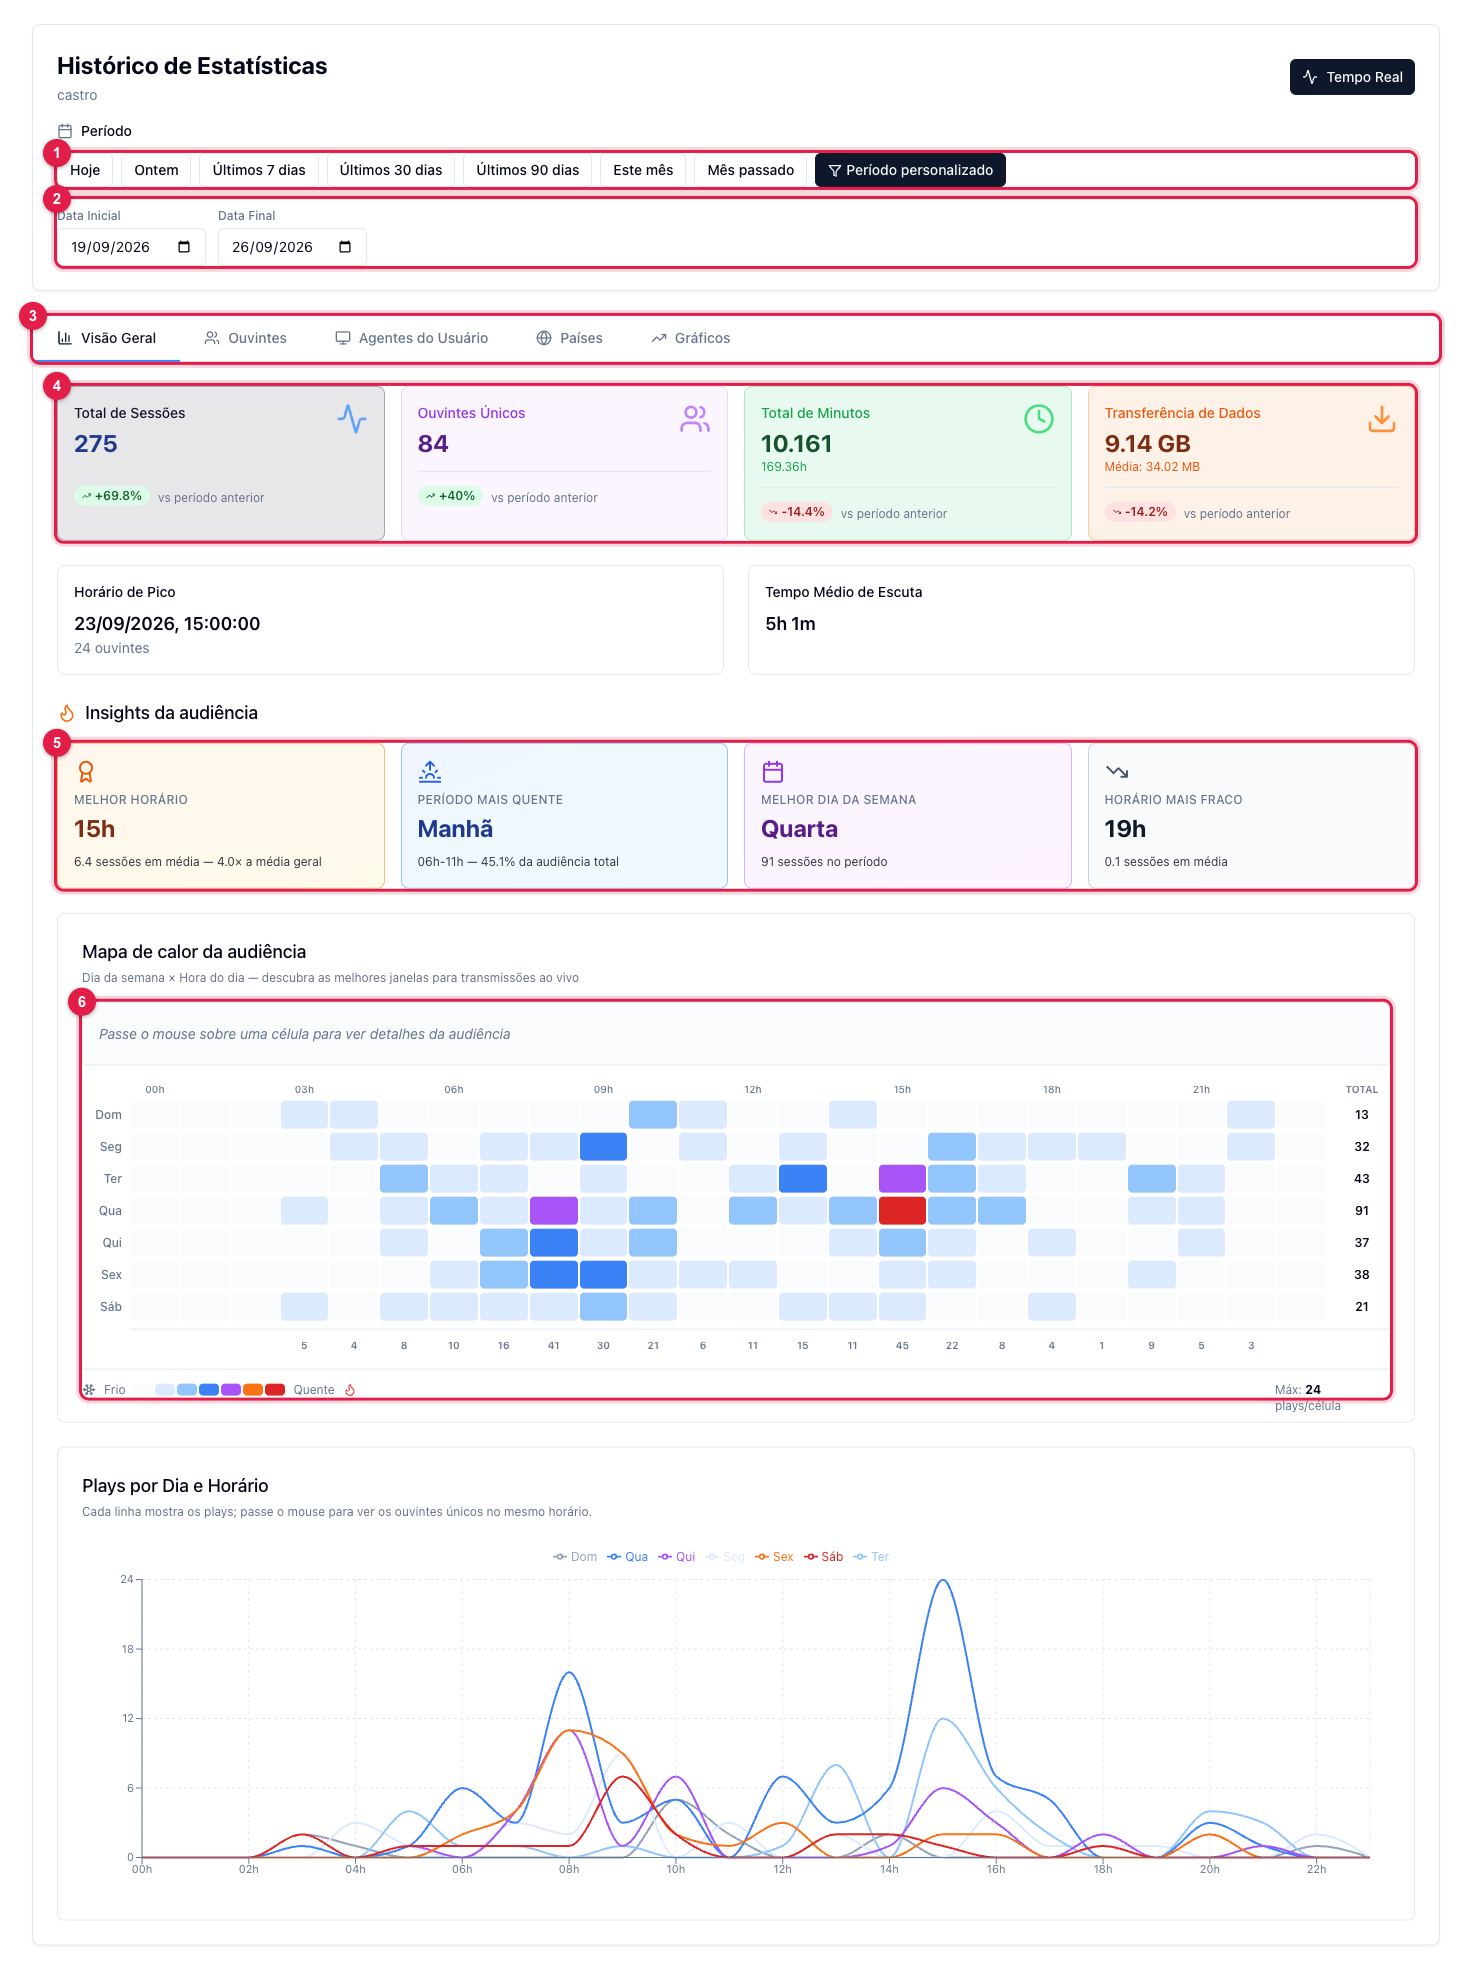
The numbers in parentheses refer to the image.
1. Choose the period
Click a shortcut (1): Today, Yesterday, Last 7 days, Last 30 days, Last 90 days, This month or Last month. For another range, Custom period opens the dates (2). Everything on the screen recalculates for the chosen period.
2. Overview
The first tab (3) brings the totals (4):
- Total Sessions — how many connections the radio received in the period.
- Unique Listeners — how many different people.
- Total Minutes — the sum of the time everyone listened (also in hours).
- Data Transfer — how much traffic the radio consumed, and the average per session.
On each card, the "vs previous period" percentage compares with the previous range of the same size: green went up, red went down. Below come the Peak Time (the moment with the most simultaneous listeners) and the Average Listening Time.
3. Audience insights (5)
Four cards that already do the math for you: the best time of day, the hottest period (morning, afternoon, evening or night), the best weekday and the weakest time. Use them to decide when to go live and when to sell the most expensive commercial break.
4. Heat map (6)
Weekday × hour of day: the darker the square, the more audience at that combination. Hover to see the number. It is the fastest way to see your radio's "window".
5. The other tabs
- Listeners — the listeners who stayed the longest, by IP address, with sessions and minutes.
- User Agents — through which player or browser people listened (the radio app, the website, TuneIn, an internet radio).
- Countries — countries and cities with sessions and minutes.
- Charts — minutes and data transferred over the period, and plays by day and hour.
What to do if…
- It shows "Calculating audience data". Long periods take a few seconds to add up; wait.
- Today's period is smaller than Real-time. The history consolidates in blocks; the last minutes are not in yet. For the instant, use Real-time.
- I want to know what played. That is the AutoDJ history: How to see what played on the radio.